Director: Statistics Resource
CommunityEnterpriseThe Resource defines the statistic collector function that can send information to a
Graphite instance, to a CSV file or to bconsole with the statistics
command (See for more information).
The explanation on how to read the directive format:
Name: Contains the linked name of the directive.
Description: Explains what the directive does.
Value: Indicates what type of value to provide (e.g., <type-specification>).
Data Type: Specifies the type of data expected.
Values: Lists specific acceptable values.
Required: If present, indicates that the directive must be set by the user, there is no default value.
Default: If present, indicates that the directive has a predefined value that does not need to be set by the user, cannot be removed.
Comment: Additional important notes.
Example: Shows a usage example.
Statistics Start of the Statistics resource. Statistics directives are optional.
Description: The Statistics directive name is used by the system administrator.
Value(s):
<name>Data Type: string
Required: Yes
Description: Description of the Statistics that will be displayed in the graphical user interface.
Value(s):
<text>Data Type: string
Description: Instructs the Statistics thread how long it should sleep between every collection iteration.
Value(s):
<time>Data Type: time
Default: 5 minutes
Description: Specifies the Statistics backend.
Value(s):
<CSV|Graphite>Data Type: string
Required: Yes
Comment: Statistics backend may be one of the following: CSV or Graphite.
CSVis a simple file level backend which saves all required metrics with the following format to the file: “<time>, <metric>, <value>\n”Where <time> is a standard Unix time (a number of seconds from 1/01/1970) with local timezone as returned by a system call time(), <metric> is a Bacula metric string and is a metric value which could be in numeric format (
int/float) or a string True or False for boolean variable. TheCSVbackend requires the File = parameter.Graphite is a network backend which will send all required metrics to a Graphite server. The Graphite backend requires the Host= and Port= directives to be set.
If the Graphite server is not available, the metrics are automatically spooled in the working directory. When the server can be reached again, spooled metrics are despooled automatically and the spooling function is suspended.
Description: Allows metric filtering. It is a filter which enables to use * and ? characters to match the required metric name in the same way as found in shell wildcard resolution.
Value(s):
<metric-name>Data Type: string list
Comment: You can exclude filtered metric with ! prefix. You can define any number of filters for a single Statistics. Metrics filter is executed in order as found in configuration. This directive is optional and if not used all available metrics will be saved by this statistics backend.
Example: See the following example:
# Include all metric starting with "bacula.jobs"
Metrics = "bacula.jobs.*"

# Exclude any metric starting with "bacula.jobs"
Metrics = "!bacula.jobs.*"
Description: Allows to alter the metrics name saved by statistics to distinguish between different installations or daemons.
Value(s):
<prefix>Data Type: string
Comment: The prefix string will be added to metric name as: “<prefix>.<metric_name>”
Description: Used for Graphite backend and specify the hostname or the
IPaddress of the Graphite server.Value(s):
<hostname>Data Type: string
Comment: When the directive Type is set to Graphite, the Host directive is required.
Description: Used for Graphite backend and specify the
TCPport number of the Graphite server.Value(s):
<number>Data Type: positive integer
Comment: When the directive Type is set to Graphite, the Port directive is required.
Description: The File is used by the
CSVstatistics backend and point to the full path and filename of the file where metrics will be saved.Value(s):
<filename>Data Type: string
Comment: With the
CSVtype, the File directive is required. The statistics thread must have the permissions to write to the selected file or create a new file if the file doesn’t exist. If statistics is unable to write to the file or create a new one then the collection terminates and an error message will be generated. The file is only open during the dump and is closed otherwise. Statistics file rotation could be executed by a mv shell command.
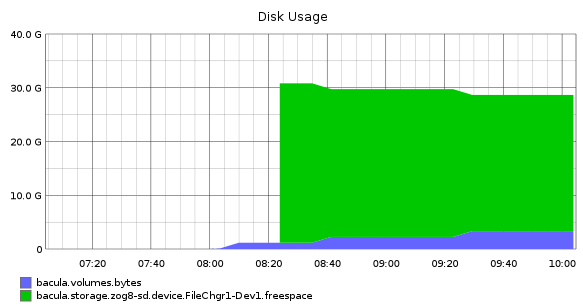
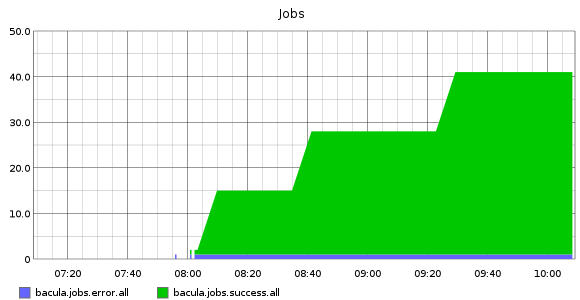
Daemon Real-Time Statistics Monitoring
All daemons can now collect internal performance statistics periodically
and provide mechanisms to store the values to a CSV file or to send
the values to a Graphite daemon via the network. Graphite is an
enterprise-ready monitoring tool (https://graphiteapp.org).


To activate the statistic collector feature, simply define a Statistics resource in the daemon of your choice:
Statistics {
    Name = "Graphite"
    Type = Graphite
    # Graphite host information
    Host = "localhost"
    Port = 2003
}
It is possible to change the interval that is used to collect the statistics with the Interval directive ( 5 mins by default), and use the Metrics directive to select the data to collect (all by default).
If the Graphite daemon cannot be reached, the statistics data are spooled on disk and are sent automatically when the Graphite daemon is available again.
The bconsole statistics command can be used to display the current statistics in various formats (text or json for now).
*statistics
Statistics available for:
    1: Director
    2: Storage
    3: Client
Select daemon type for statistics (1-3): 1
bacula.dir.config.clients=1
bacula.dir.config.jobs=3
bacula.dir.config.filesets=2
bacula.dir.config.pools=3
bacula.dir.config.schedules=2
...
*statistics storage
...
bacula.storage.bac-sd.device.File1.readbytes=214
bacula.storage.bac-sd.device.File1.readtime=12
bacula.storage.bac-sd.device.File1.readspeed=0.000000
bacula.storage.bac-sd.device.File1.writespeed=0.000000
bacula.storage.bac-sd.device.File1.status=1
bacula.storage.bac-sd.device.File1.writebytes=83013529
bacula.storage.bac-sd.device.File1.writetime=20356
...
The statistics bconsole command can accept parameters to be scripted. For example, it is possible to export the data in JSON, or to select which metrics to display.
*statistics bacula.dir.config.clients bacula.dir.config.jobs json
[
    {
        "name": "bacula.dir.config.clients",
        "value": 1,
        "type": "Integer",
        "unit": "Clients",
        "description": "The number of defined clients in the Director."
    },
    {
    "name": "bacula.dir.config.jobs",
    "value": 3,
    "type": "Integer",
    "unit": "Jobs",
    "description": "The number of defined jobs in the Director."
    }
]
The .status statistics command can be used to query the status of the Statistic collector thread.
*.status dir statistics
Statistics backend: Graphite is running
    type=2 lasttimestamp=12-Sep-18 09:45
    interval=300 secs
    spooling=in progress
    lasterror=Could not connect to localhost:2003 Err=Connection refused
Update Statistics: running interval=300 secs lastupdate=12-Sep-18 09:45
*
See also
Previous articles:
Go back to: Director Resource Types.