Create Widget in BWeb and Add Graphite Metrics to Dashboard
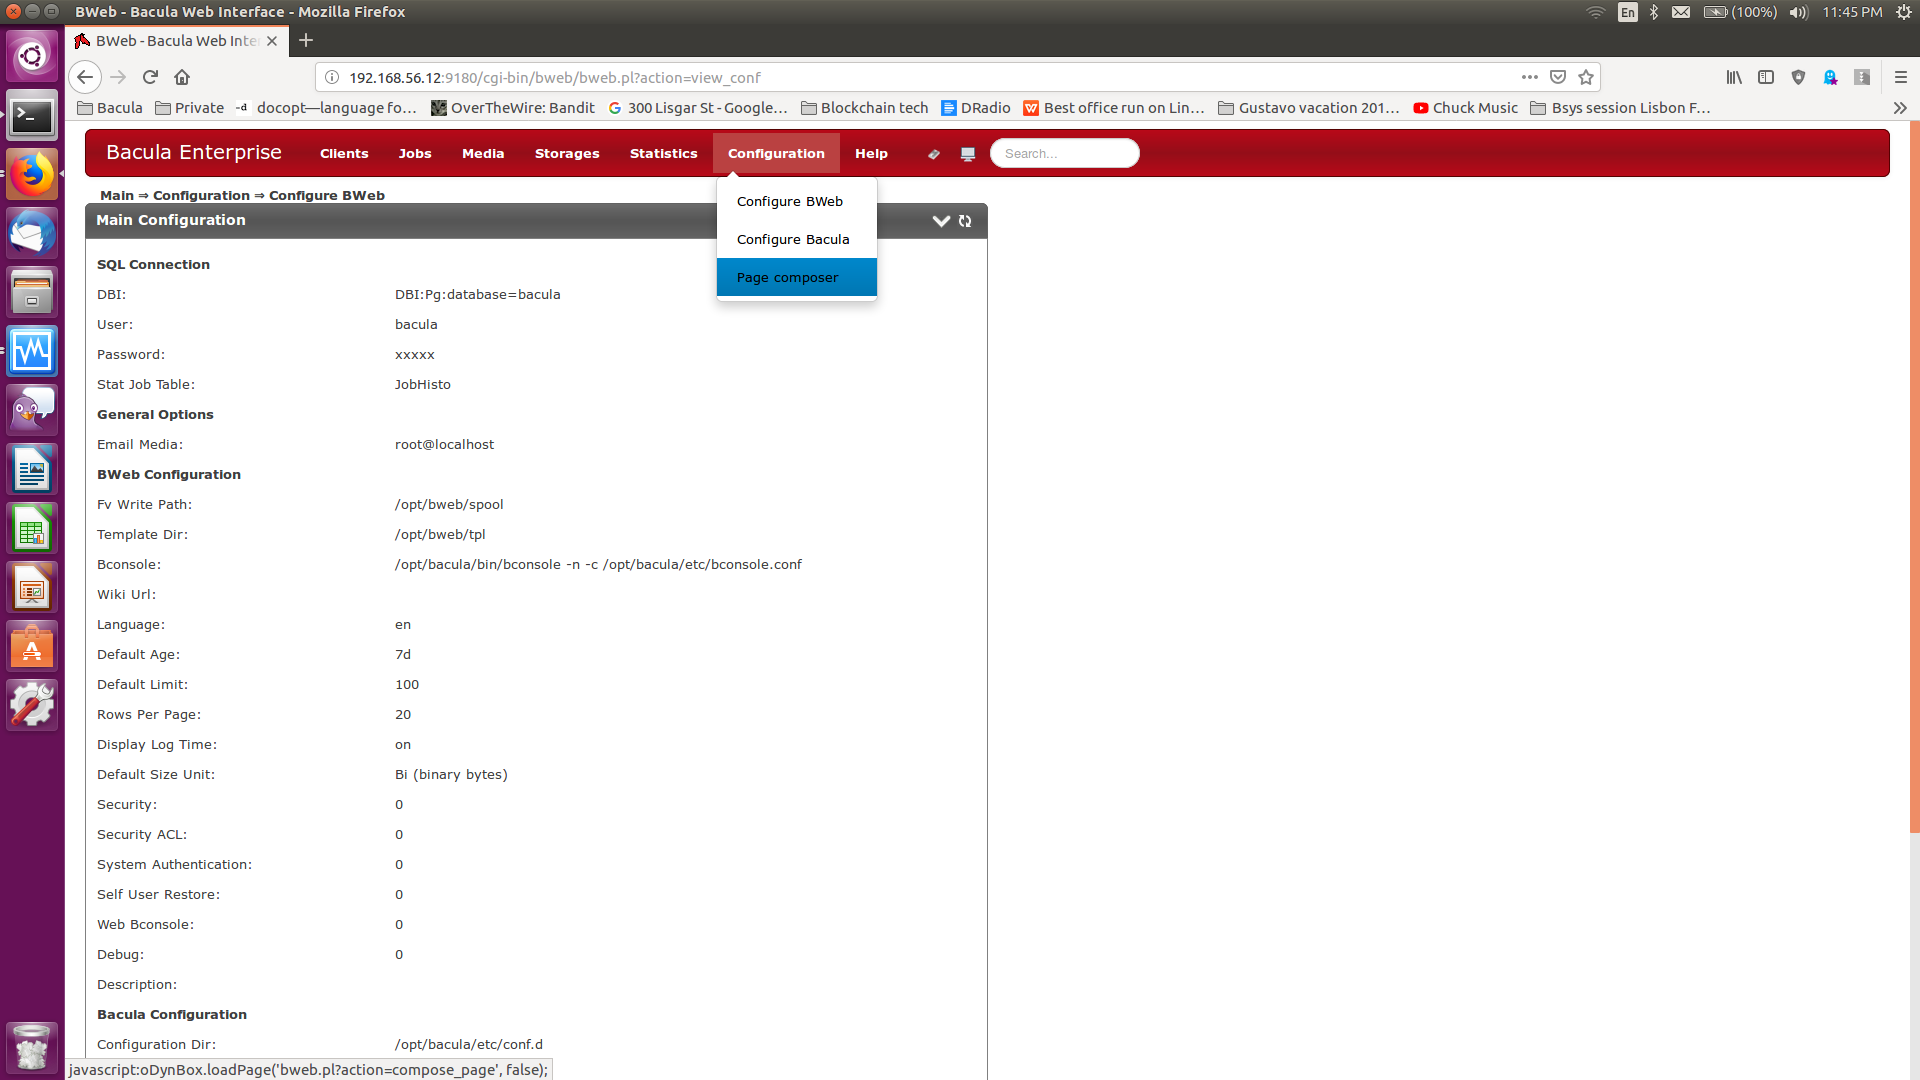
In BWeb choose Configuration | Page Composer from the top menu. The button “Add new box” will allow you to create a custom graph based on the Graphite metrics: you choose a name for the new box/widget and an ID, then you enter the URL exported in step 4 and you can specify a custom refresh interval (each box in the BWeb dashboard can have its own refresh interval).

Confirm with “Add box” and drag and drop the new box into the page composer main window to modify your BWeb dashboard. You can change the position and size of the widgets.

See also
Previous articles:
Go back to: BWeb with Graphite.